This chapter contains the following topics:
Introduction to Management Reports
This selection allows you to print several types of reports. Each selection lets you choose between several formats and options.
The Job Status Report is discussed in its own chapter. The various edit lists and registers are also not included in this chapter but are to be found in the chapters dealing with those selections.
If you answered Y to the question Access inactive files ? (in Control information), you can use this selection to print information from either the active files/tables or the inactive files/tables—depending on which mode you are currently in but never from both in the same report. Refer to the Using Job Cost chapter for instructions on switching from one mode to the other. Be aware that the report headings do not indicate whether a report is derived from the active files or the inactive ones.
When using the active files, you can exclude completed details from the report by purging them or by saving them in Detail Holdings. This process is described in the Utility chapter.
Most of these reports allow selection of a job or range of jobs. In general, only active, closed, and (in some cases) unreconciled jobs can be entered. New, in-progress, and copy-only jobs can be included as part of a range, but are not printed on the report. Exceptions are noted as they occur. Purged jobs cannot of course be printed. If this is a problem, consider saving your jobs instead of purging them—the saving in disk space is the same, and the security is better.
Select
Reports from the J/C menu and then select the desired report.
This report is similar to the Job Status Report, but shows the budgeted, actual, and projected quantities associated with each cost item, as well as the costs. It shows you how much labor, material, subcontract work, etc., you are using on jobs, compared to how much you expected to use.
You may view a Performance report example in the Sample Reports appendix.
Select
Performance from the Reports menu.
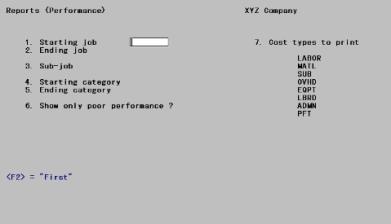
The following screen displays:
Enter the following information:
1. Starting job and
2. Ending job
Enter the range of jobs to show. Follow the screen instructions.
|
Format |
7 characters at each field |
|
Example |
Type 602 at the starting field Press <F2> for Last at the ending field |
3. Sub-job
If you have selected a range of jobs, this field is automatically set to All and cannot be entered.
If you have a single job, which does not use sub-jobs, this field is automatically set to (Not applicable) and cannot be entered.
Options
Otherwise, enter the sub-job number here to show cost items for a single sub-job, or use the option:
|
<F5> |
For All sub-jobs |
|
Format |
999 |
|
Example |
[This field is skipped because this job does not use sub-jobs.] |
4. Starting category and
5. Ending category
Enter the range of cost categories to show. Follow the screen instructions.
|
Format |
9999999 at each field |
|
Example |
Press <F2> for the starting category Type 170000 for the ending category |
6. Show only poor performance ?
This option allows you to pinpoint those areas of jobs where you are doing significantly worse than you expected.
| • | If you answer N here, all cost items are shown and you are not asked the next two questions. |
| • | If you answer Y, you then define what you mean by poor performance. This is what the next two questions are for. |
|
Format |
One letter, either Y or N. There is no default. |
|
Example |
Type N |
Actual rate ¸ expected rate
Cost items that have units associated with them have an expected rate. This is the cost per unit that you expect to incur for this type of work or material. You entered this when you were originally entering the cost items for your jobs.
As costs are incurred for work or material, an actual rate can be calculated, using the actual costs incurred and the actual number of units completed. The ratio of the actual rate to the expected rate shows actual performance, compared to expected performance.
For example, if this ratio is 2, this means that each unit of work or material is actually costing twice as much as expected. If the ratio is 0.5, each unit of work or material is costing half as much as expected.
The number you enter here is a cut-off. Any cost item whose performance is worse than this cut-off is shown on the report. If performance for the cost item is at least as good as the cut-off, this cost item is not shown on the report.
|
Format |
9.9 |
|
Example |
[Does not apply in this example because you responded N to Field #6.] |
Estimated percent complete
If a job has just been started, you do not usually have enough experience yet to give an accurate idea of how efficiently and effectively work is being done, or material is being used. Only after work has gone on for awhile can you get an accurate picture of performance.
The percent complete figure you enter here is used as a cut-off for each cost item on the job. If the last completion percent estimate for the cost item is less than or equal to this cut-off, the cost item is not shown on the report, even if performance is extremely poor so far. For instance, if you wish to include only cost items, which are 20% or more complete, enter 19% here.
|
Format |
99 |
|
Example |
[Does not apply in this example because you responded N to Field #6.] |
Using this feature also prevents Job Cost from reporting cost items that haven’t yet been started; otherwise, this could be interpreted as poor performance.
7. Cost types to print
Options
You can further limit this report by selecting which cost types to show cost items for. All the cost types you use are listed on the screen as separate subfields. This includes the four predefined ones (labor, material, subcontract and profit) plus those you defined in Control information. Answer Y or N for each subfield, or use the option:
|
<F5> |
For All cost types. This option applies only at the first subfield. |
|
Format |
One letter, either Y or N, at each subfield. The default is N. At least one field must be Y. |
|
Example |
Press <F5> |
Field number to change ?
Make any needed changes. Upon pressing <Enter> from a blank field, the Performance Report will be printed.
This report is similar to the Performance Report, except that it shows only labor cost items. It shows hours worked, as well as units completed (the Performance Report does not show hours worked). This report also shows the difference between actual and budgeted amounts for labor costs and labor hours.
You may view a Labor Analysis report example in the Sample Reports appendix.
Select
Labor analysis from the Reports menu.
The following screen displays:
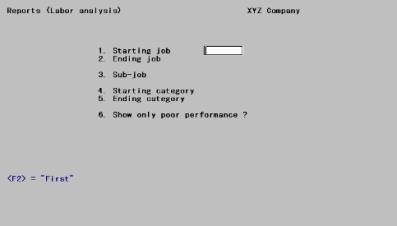
Enter the following information:
1. Starting job and
2. Ending job
Enter the range of jobs to be included. The job numbers entered need not themselves be on file, but the range defined by them must encompass at least one job. Follow the screen instructions.
|
Format |
7 characters at each field |
|
Example |
Type 602 for the starting job Press <F2> for Last at the ending field |
3. Sub-job
If you have selected a range of jobs, this field is automatically set to All and cannot be entered.
If you have a single job, which does not use sub-jobs, this field is automatically set to (Not applicable) and cannot be entered.
Options
Otherwise, you can show the entries for a single sub-job by entering the sub-job number here or you can use the option:
|
<F5> |
For All sub-jobs |
|
Format |
999 |
|
Example |
[Not applicable to this example because you have specified a range of jobs.] |
4. Starting category and
5. Ending category
|
Format |
9999999 at each field |
|
Example |
Press <F2> for First as the starting category Type 520000 for the ending category |
6. Show only poor performance ?
Answer Y to pinpoint those areas of jobs, which are performing significantly worse than expected. Two criteria describe what you mean by poor performance. These will be entered in the next two fields.
Answer N to ignore performance as a criterion for printing. The next two questions will not appear.
|
Format |
One letter, either Y or N. There is no default. |
|
Example |
Type N |
Cost and/or hours variance
Cost variance is the difference between the actual cost and the expected cost. Hours variance is the difference between the actual hours and the expected hours. The minimum acceptable variance is entered as a percentage.
For labor cost items, this threshold will be used for both cost variance and the hours variance. If either one exceeds the cut-off, the cost item will be shown on the report; otherwise, it will be skipped.
For example, if you enter 50 here, a cost item will be printed only if it is costing at least 50% more than expected, or taking at least 50% more labor hours than expected.
|
Format |
999 |
|
Example |
[Does not apply in this example because you responded N to Field #6.] |
Estimated percent complete
The figure you enter here is a cut-off for each cost item on a job. If the last completion estimate for the cost item is not greater than this cut-off, the cost item is not shown on the report, even if performance has been extremely poor so far.
If a job has just been started, then there is usually not enough experience yet to get an accurate idea of how efficiently and effectively work is being performed. Only after work has gone on for a while can an accurate picture of performance be obtained.
|
Format |
99 |
|
Example |
[Does not apply in this example because you responded N to Field #6.] |
Using this feature also prevents J/C from reporting cost items that you haven’t even started yet, as if they were performing poorly.
Field number to change ?
Make any needed changes. Upon pressing <Enter> from a blank field, the Labor Analysis Report will be printed.
This is also sometimes called the Bonding Report. It shows the current status of the job, the current profit or loss on that job, the earned revenue to date, and the billing status to date.
The Profitability Report shows if costs are over or under billings. You can also use this report as a worksheet to record the current billing and the results of this billing.
You may view a Profitability report example in the Sample Reports appendix.
Select
Profitability from the Reports menu.
The following screen displays:
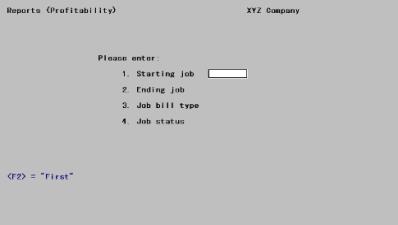
Enter the following information:
1. Starting job and
2. Ending job
Enter the range of jobs to show. Follow the screen instructions.
|
Format |
7 characters at each field |
|
Example |
Type 602 at the starting field Press <F2> for Last at the ending field. |
3. Job bill type
Options
Enter either:
|
F |
Shows only fixed-fee jobs |
|
P |
Shows cost-plus jobs |
|
Blank |
Shows both types |
|
Format |
One letter from the list above. Blank is the default. |
|
Example |
Press <Enter> to accept the default. |
4. Job status
Options
This lets you restrict the report to jobs with a particular status or combination of statuses:
|
A |
Active jobs |
|
C |
Closed jobs |
|
I |
In-progress jobs (jobs that have not yet been activated) |
You can also use the option:
|
<F5> |
For All three of the above job statuses (but no others) |
|
Format |
One or two characters from the list above. The default is Blank. |
|
Example |
Press <F5> for All statuses. |
Field number to change ?
Make any needed changes. Upon pressing <Enter> from a blank field, the Profitability Report will be printed.
Explanation of calculations
Options
The formulas below explain how the figures on the Profitability Report are calculated.
|
|
Quantity |
|
Equation |
|
A |
Price including changes |
= |
job price + price of all change orders |
|
B |
Actual cost to date |
= |
sum of all actual costs for the job and all change orders to date, for all cost items except profit |
|
C |
Estimated cost at completion |
= |
B + sum of all costs-to-complete for all cost items (except profit) for the job and for all change orders Includes any amounts entered for outstanding Purchase Orders |
|
D |
Estimated profit (loss) at completion |
= |
A - C |
|
E |
Profit earned to date |
= |
(B/C) X D (if profit) D (if loss) |
|
F |
Profit previously recognized |
= |
sum of all previously posted recognized profit |
|
G |
Profit to be recognized |
= |
E - F |
|
H |
Earned revenue |
= |
B + E (if profit) B or A, whichever is less (if loss) |
|
I |
Amount billed |
= |
sum of all previously posted billings, plus debit memos, less credit memos |
|
J |
Billings over cost |
= |
I - H (if I is greater than H) |
|
K |
Cost over billings |
= |
H - I (if H is greater than I) |
Select
the desired report from the Reports menu.
There are eight possible choices for printing these job entry (transaction) reports.
These reports give you a list of the costs and billings entered for jobs, as long as you have not saved or purged these entries. Refer to the Utility chapter for an explanation of saving and purging cost and billing entries.
Before you use Get costs to update your job costs with costs from other Passport Business Solutions modules, you should print the specific entry report from each other module which shows the costs you want to obtain from that module.
In particular, before you get costs from Accounts Payable, Payroll, or Inventory Control, you should print the report of costs in job number order from the appropriate module (see below). This will show you exactly which costs will be sent to Job Cost. Refer to the Get Costs chapter for further details.
After you select the entry report you wish to print, you are given a set of options to choose from. These options further limit the entries shown on the report.
First, we’ll look at the eight different types of entry reports, then the options you can use in printing these reports.
The sources of costs that are shown on these reports are:
| • | J/C—PBS Job Cost |
| • | A/P—PBS Accounts Payable |
| • | PR—PBS Payroll |
| • | I/C—PBS Inventory Control |
| • | G/L—PBS General Ledger |
The sources of billings/payments are:
| • | J/C—PBS Job Cost |
| • | A/R—PBS Accounts Receivable |
| • | G/L—PBS General Ledger (only for recognized profit) |
All of these reports show either the costs or the billings/payments associated with your jobs. They can be restricted to a range of jobs, dates, and categories, and in other ways appropriate to each report.
These reports are documented together partly because the screens share a common format and partly because they are selected directly from the Reports menu.
Most of these reports are available only when you are interfaced to some other PBS module. If you are not, that particular selection is not available. The table below lists and describes the eight reports, and shows, the module required by each one.
|
Rpt. No. |
Report |
Pkg |
|
1 |
Costs by job - shows all costs for jobs, including those entered in J/C and those deriving from any interface module. These are shown in the order: job number, cost item number, and date of the cost entry. |
(n/a) |
|
2 |
Payables by job # - shows only those costs entered for jobs in A/P, in the order: job number, cost item number, and date of the payable entry. Only non-A/P checks show a check number and date. |
A/P |
|
3 |
Payables by vendor # - shows the same costs as the previous report, but in a different order. The order is vendor number, job number, cost item number, and date of the payable entry. Only non-A/P checks show a check number and date. |
A/P |
|
4 |
Payroll by job # - shows only those costs entered for jobs in PR, and in the order: job number, cost item number, and date of the cost entry. |
PR |
|
5 |
Payroll by employee # - shows the same costs as the previous report, but in a different order: employee number, job number, date of the cost entry, and cost item number. |
PR |
|
6 |
Inventory - shows only those costs entered for jobs in I/C, in the order: job number, cost item number, and the date of the cost entry. |
I/C |
|
7 |
Billings/Payments by job # - shows billings/payments for jobs. These are billings/payments entered directly in J/C, as well as those made for jobs in A/R (if so interfaced). The order is: job number, sub-job number, and date of the billing/payment entry. |
|
|
8 |
Billings/Payments by cust # - shows billings/payments for jobs. These are billings/payments entered in A/R, and in the order: customer number, job number, and date of the billing/payment entry. |
A/R |
Reports 7 and 8 above also show recognized profit entered through General Ledger.
All these reports share the same entry screen, with slight variations for each report. Of the two screens below, the first is typical for cost-related reports and the second for payment-related reports. The variations will be described (without further illustration) as they occur.
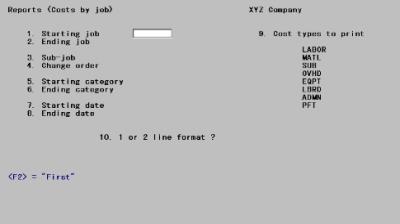
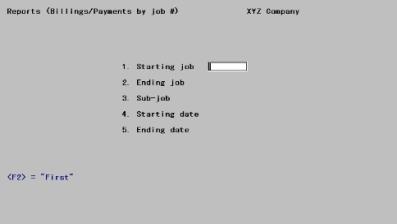
Enter the following information:
1. Starting job and
2. Ending job
These fields do not appear on the screen for the Billings/payments by Customer # Report.
Enter the range of jobs to be printed. Follow the screen instructions.
|
Format |
7 characters at each field |
|
Example |
Type 602 at the starting field Press <F2> for Last at the ending field. |
1. Starting customer and
2. Ending customer
These fields appear on the screen only for the Billings/payments by Customer # Report.
Enter the range of customers to be printed. Follow the screen instructions.
|
Format |
12 characters at each field |
|
Example |
Press <F2> at each field for First through Last. |
3. Sub-job
This field does not appear on the screen for the Billings/payments by Customer # Report.
If you have selected a range of jobs, this field is automatically set to All and cannot be entered.
If you have a single job, which does not use sub-jobs, this field is automatically set to (Not applicable) and cannot be entered.
Otherwise, you can show the entries for a single sub-job by entering the sub-job number here or you can use the option:
Options
A sub-job can be specified whether or not the job bills sub-jobs individually even in the Billings/payments by Job # Report, where it will always result in No detail items in range selected.
|
<F5> |
For All sub-jobs |
|
Format |
999 |
|
Example |
[This field is skipped because this job does not use sub-jobs.] |
4. Change order (CO)
This field does not appear on the screen for either of the Billings/payments reports.
If you have selected a range of jobs, this field is automatically set to All and cannot be entered.
If you have chosen (in Control information) not to use change orders, this field is automatically set to (Not applicable) and cannot be entered.
Otherwise, you can enter a change order number (present in this job or sub-job). Only the change order will print.
Options
You can also use one of the options:
|
<F5> |
For the job or sub-job and All its change orders |
|
Blank |
For the job or sub-job without any of its change orders |
|
Format: |
999 |
|
Example |
[This field is skipped because you are printing a range of jobs.] |
5. Starting category and
6. Ending category
These fields do not appear on the screen for either of the Billings/payments reports.
Enter the range of cost categories to show. Follow the screen instructions.
|
Format |
9999999 |
|
Example |
Press <F2> for the starting category Then type 170000 for the ending category |
7. Starting date and
8. Ending date
On the Billings/payments by Job # Report, these fields appear but are numbered 4 and 5 rather than 7 and 8, on the Billings/payments by Customer # Report, they are numbered 3 and 4.
Enter the range of dates to show. Follow the screen instructions.
|
Format |
MMDDYY for each field |
|
Example |
Press <F2> at each field for Earliest through Latest. |
9. Cost types to print
This field does not appear on the screen for either of the Billings/payments reports.
Options
You can select which cost types to show cost items for. All the cost types you use are listed on the screen as separate subfields. This includes the four predefined ones (labor, material, subcontract and profit), plus any you defined in Control information. Answer Y or N for each subfield, or use the option:
|
<F5> |
For All cost types. This option applies only at the first subfield. |
|
Format |
One letter, either Y or N, at each subfield. The default is N. At least one subfield must be Y. |
|
Example |
Press <F5> at the first subfield. |
10. Show only entries not yet interfaced to jobs ?
You will be asked this question only for the following reports:
| • | A/P entries—Payables by Job # Report |
| • | PR entries—Payroll by Job # Report |
| • | I/C entries—Inventory Report |
This question allows you to limit the entries on your report to only those not yet interfaced to jobs (through Get costs). You can use this feature to preview the results of Get costs before actually committing to it.
|
Format |
One character, either Y or N. The default is Y. |
|
Example |
Type N to show all entries. |
10. 1 or 2 line format ?
This field displays on the screen only for the Costs by Job Report.
The one-line format will give you a shorter report. The information shown on the second line applies only to entries entered in other PBS modules. If you are not interfacing to any, use the one-line format.
|
Format |
One digit, either 1 or 2. There is no default. |
|
Example |
Type 2 |
10. Starting vendor and
11. Ending vendor
These fields appear only on the Payables by Vendor # Report.
Enter the range of vendors to show. Follow the screen instructions.
|
Format |
6 characters at each field |
|
Example |
Press <F2> at each field for First through Last. |
10. Starting employee and
11. Ending employee
These fields appear only on the Payables by Employee # Report.
Enter the range of employees to show. Follow the screen instructions.
|
Format |
999999 at each field |
|
Example |
Press <F2> at each field for First through Last. |
Field number to change ?
Make any needed changes. Upon pressing <Enter> from a blank field, the desired report will be printed.
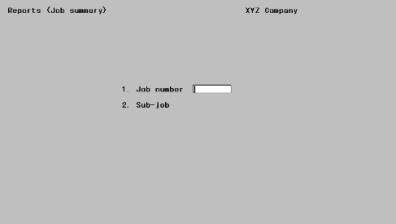
This report will help you in preparing bills for your customers for individual jobs.
For each job or sub-job, it shows (by the most major cost category groupings) the following:
| • | The price which you have agreed upon or budgeted (including change orders) |
| • | Your actual cost for this time period and for job-to-date |
| • | The percent of completion (actual cost incurred job-to-date, vs. price [budgeted cost] for job-to-completion) |
| • | Balance-to-complete (the budgeted costs not yet incurred), and |
| • | The amount to be billed in your next progress billing. |
You should run this at the end of each period, after all costs for that period are entered and posted.
You may view a Job Summary report example in the Sample Reports appendix.
Select
Job summary from the Reports menu.
The following screen displays:
Enter the following information:
1. Job number
Enter the number of the job to show.
|
Format |
7 characters |
|
Example |
Type 602 |
2. Sub-job
If this job does not have sub-jobs, or does not bill for them, this field displays as (Not applicable) and cannot be changed.
Options
Otherwise, enter the number of the sub-job to show, or use the option:
|
<F5> |
For All sub-jobs |
|
Format |
999 |
|
Example |
[This field is skipped because this job has no sub-jobs.] |
Field number to change ?
Make any needed changes. Upon pressing <Enter> from a blank field, the Job Summary will be printed.
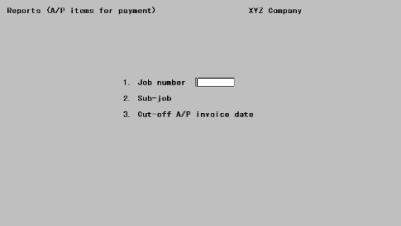
If you are not interfaced to A/P, (as specified in J/C Control information) skip this section, as you will not be able to enter this selection.
This report shows the A/P items (invoices) which are eligible to be paid to your vendors (suppliers/subcontractors) for the job or sub-job[s] specified. Eligibility is determined by the cut-off A/P invoice date that you specify.
Run this after you have received payment from a customer for a job. Make sure all invoices have been posted in A/P before running the report.
Select
A/P items for payment from the Reports menu.
The following screen displays:
Enter the following information:
1. Job number
Enter the number of the job to show.
|
Format |
7 characters |
|
Example |
[No example is given because in Control information you specified that you were not interfaced to A/P.] |
2. Sub-job
If this job does not have sub-jobs, (Not applicable) will display here. You can print a report for a single sub-job even though this job does not bill sub-jobs separately.
Options
Otherwise, enter the number of the sub-job you wish printed, or use the option:
|
<F5> |
For All sub-jobs |
|
Format |
999 |
|
Example |
[No example is given because in Control information you specified that you were not interfaced to A/P.] |
3. Cut-off A/P invoice date
Enter the cut-off date. Payables dated later than this date will not be included on this report.
|
Format |
MMDDYY. There is no default. |
|
Example |
[No example is given because in Control information you specified that you were not interfaced to A/P.] |
Field number to change ?
Make any needed changes. Upon pressing <Enter> from a blank field, the A/P Items for Payment Report will be printed.
If you have specified (in Control information) that you do not use Cost Categories, skip this section, as you will not be able to enter this selection.
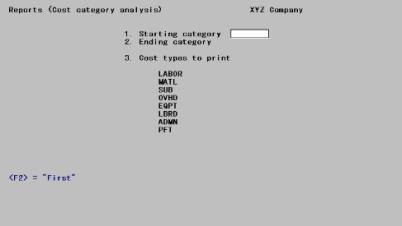
This report shows the costs incurred for each cost category across all jobs. Costs are shown only for individual categories, not for groups. The report is not specific to jobs, but instead shows how you have been doing with regard to each type of work that your company does or each type of material that you use, regardless of the specific job worked on.
It shows the cost and quantity (and hours for labor) incurred or used for the current period, the last period, and the current year. It also gives cost per unit, cost per hour, hours per unit, and units per hour for all three time periods.
Run this at the end of each period, after all costs for that period are entered and posted.
You may view a Cost Category Analysis report example in the Sample Reports appendix.
Select
Cost category analysis from the Reports menu.
The following screen displays:
Enter the following information:
1. Starting category and
2. Ending category
Enter the range of categories to show. Follow the screen instructions.
|
Format |
9999999 at each field |
|
Example |
Press <F2> at each field, for First through Last |
3. Cost types to print
Options
You can further limit this report by selecting which cost types to show cost items for. All the cost types you use are listed on the screen as separate subfields. This includes the four predefined ones (labor, material, subcontract and profit) plus those you defined in Control information. Answer Y or N for each subfield, or use the option:
|
<F5> |
For All cost types. This option applies only at the first subfield. |
|
Format |
One letter, either Y or N, at each subfield. The default is N. At least one entry must by Y. |
|
Example |
Press <F5> |
Field number to change ?
Make any needed changes. Upon pressing <Enter> from a blank field, the Cost Category Analysis will be printed.
This report is useful for a company, which does many short jobs of a couple of days duration—for example, a print shop or a plastic molding business. With many jobs, it becomes impractical to give a lot of individual attention to the closing of each job. This option greatly simplifies the job closing process for such a company. Printing this report neither closes nor purges a job.
For each job, the report shows the budgeted cost, the actual cost, and the difference. It also shows the contract price (including any change orders), the total billed so far, and the difference. For each job, space is provided to note any action required. Grand totals are shown for the cost and price figures.
Select
Job closing from the Reports menu.
The following screen displays:
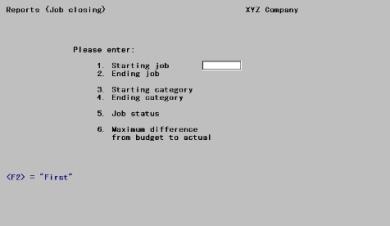
Enter the following information:
1. Starting job and
2. Ending job
Enter the range of jobs to show. Follow the screen instructions.
|
Format |
7 characters at each field |
|
Example |
Type 602 at the starting field Press <F2> for Last at the ending field. |
3. Starting category and
4. Ending category
Enter the range of categories to show. Follow the screen instructions.
|
Format |
9999999 at each field |
|
Example |
Press <F2> for the starting category Type 170000 for the ending category |
5. Job status
Options
Enter one of the following:
|
A |
Active jobs |
|
C |
Closed jobs |
|
B |
Both active and closed jobs |
|
Format |
One letter from the list above. There is no default. |
|
Example |
Type A |
Closed since ?
If you chose C or B in the previous field, you are asked to enter a Closed since date. Only jobs closed since this date will print.
Format MMDDYY There is no default.
Example [Does not appear in this example because you entered A in the previous field.]
6. Maximum difference from budget to actual
Enter the threshold cost overrun, which qualifies a job to appear on this report. For instance, if you enter $1,000, a job, which was budgeted at $4,500 and actually cost $3,800 so far would print, but a job which was budgeted at $4,500 and actually cost $2,300 so far would not print.
Using this feature, you can eliminate from the report those active jobs, which are far from completion.
All jobs on which the actual costs exceeded the budgeted cost are also shown.
|
Format |
999,999,999 |
|
Example |
Type 500 |
Field number to change ?
Make any needed changes. Upon pressing <Enter> from a blank field, the Job Closing Report will be printed.